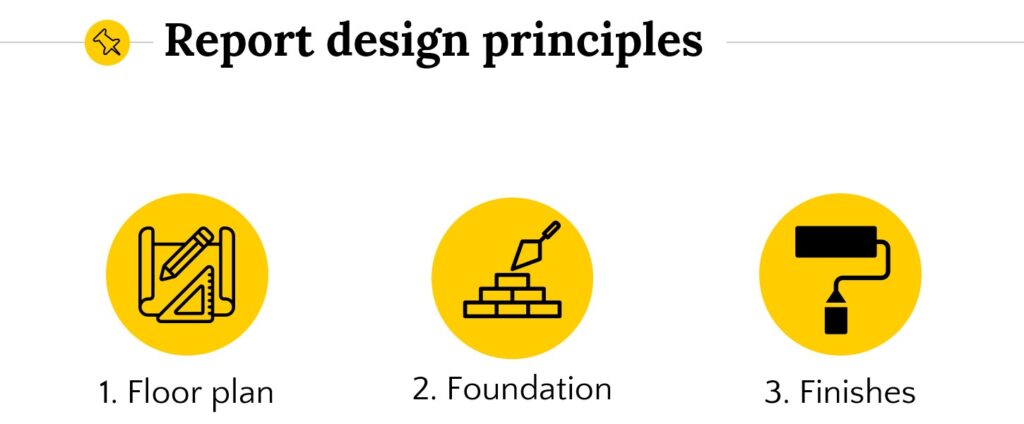
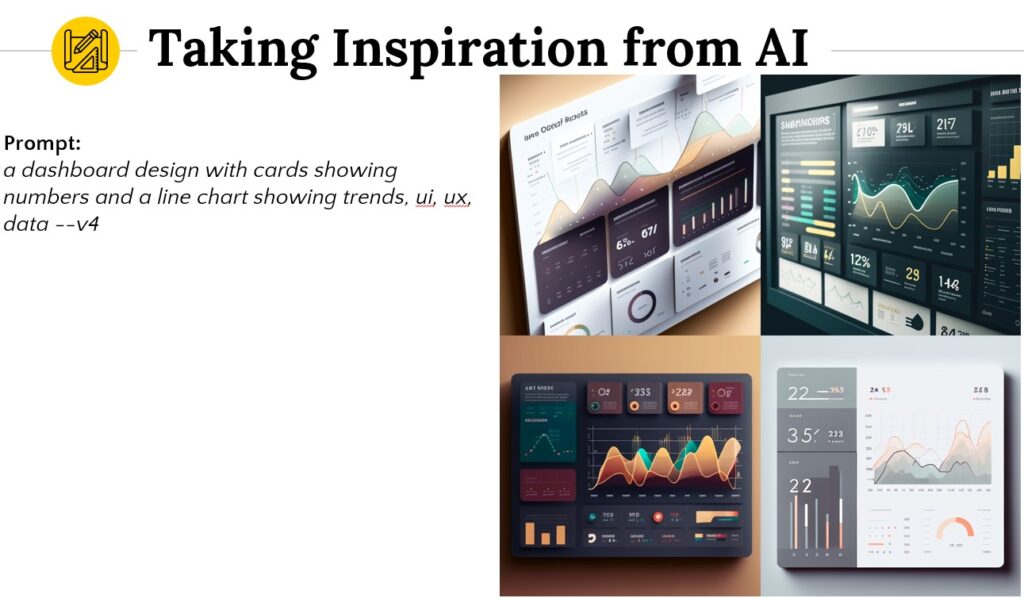
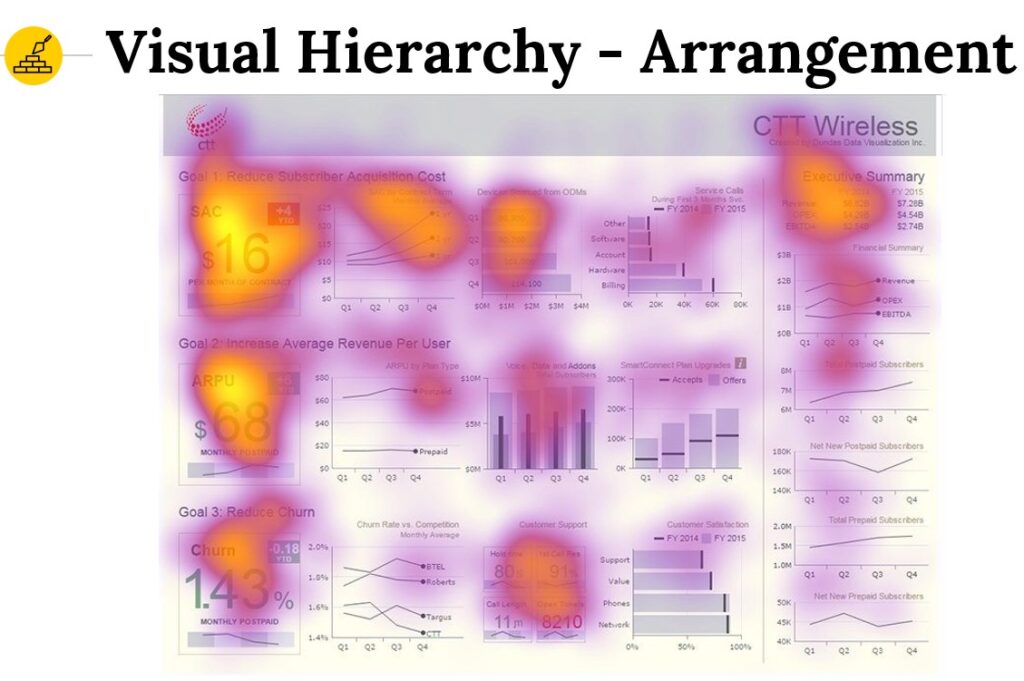
Data visualisation principles for Power BI 3-step process for designing better dashboards By FLAVIO MENESES ★ 2 min read 06 February 2023 To kick-off the new Birmingham Power BI Meetup Group I had the pleasure of presenting alongside Microsoft’s Rui Romano. I shared the 3-step process I follow to design better dashboards: We explored the use of AI to get inspiration for designs and make the process even easier: Source: Midjourney We also looked at science to learn where we should place visuals for maximum user attention based on eye tracking studies: Source: https://www.tableau.com/blog/how-design-thinking-will-affect-todays-analysts-93507 Finally we looked at multiple case studies to identify how to apply these rules and avoid the pitfalls!The slides are available for download below.