You might have heard of Copilot for Power BI, an AI assistant capable of giving you recommendations and automate various tasks within Power BI.
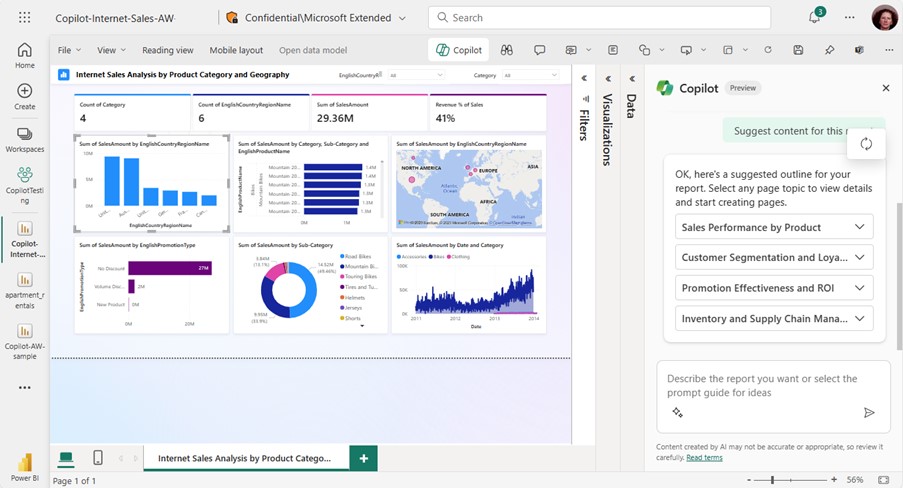
We’ve seen the capabilities of Copilot in various demos, for example suggesting pages for a report, creating those pages by itself, documenting measures and even writing DAX.
Copilot for Power BI can suggest and even create report pages! Source: Microsoft
The Problem
Despite the impressive capabilities, there’s a catch; as mentioned in the documentation, this is currently only supported on F64/P1 capacities, and not available on trials.
Looking at the pricing, that’s almost £8,000/month in the UK which puts this great feature out reach for most small to medium companies. Hopefully, this will be made available to other Fabric SKUs, in the near future, but for the time being it’s a barrier for wider adoption.
We can however implement a low-cost alternative, with equally interesting capabilities. In this blog we’ll see how, using Power BI Developer Mode and a Large Language Model (LLM), such as ChatGPT.
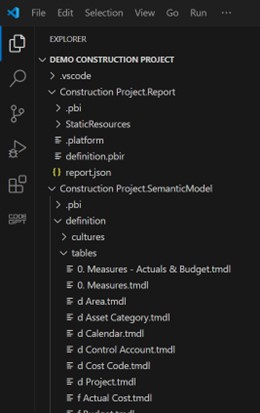
When you save your report as a Power BI Project, this exposes all the metadata about that report such as tables, measures, report pages or visuals. As we’re able to see “under the hood” we can use this to automate a number of tasks with AI!
Power BI Project - this is a preview feature you'll have to enable on Power BI Desktop
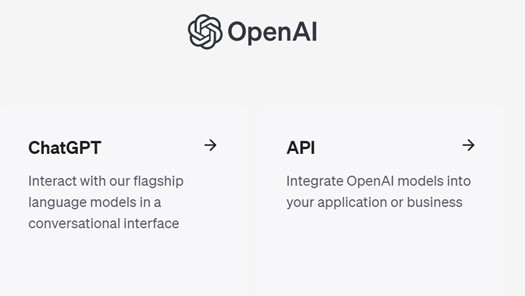
As for the LLM we have two choices: the familiar ChatGPT assistant or the API. For this demo we’ll go with the second option to integrate seamlessly with VS Code, but if you’ll be using this heavily you might want to consider the cost implications and get a ChatGPT Plus license instead – it’s a trade-off between cost and convenience!
Two options to access OpenAI's powerful models
Once you’ve registered your account, you’ll need to fund it. For this demo, I topped mine up with just $5.00, which was more than enough to run lots of tests and still have plenty of credits left.
You could try to use the free API but I wouldn’t recommend as you’ll hit the limits very quickly and you can’t take advantage of the impressive new gtp-4o which is both the most powerful and cheapest model from OpenAI.
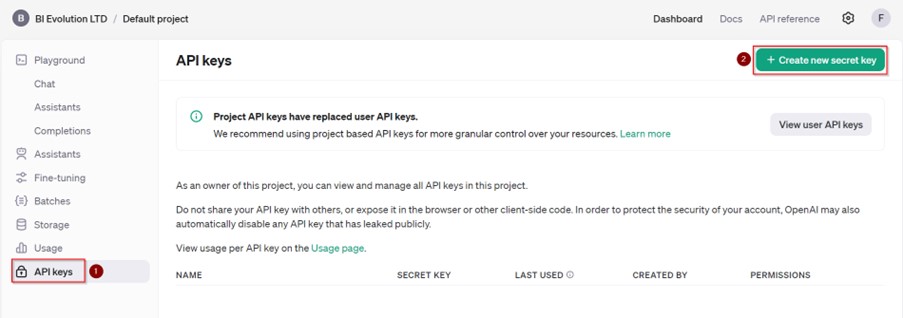
Then you’ll need to create an API Key as shown below. Save it somewhere safe as it’s specific to your account and you won’t be able to get it again once the dialog box closes. You can easily create a new one if needed.
Create an API Key
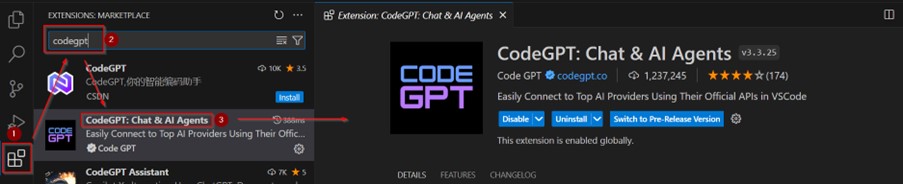
Finally, on VS Code you’ll just need to install the CodeGPT extension.
Install CodeGPT
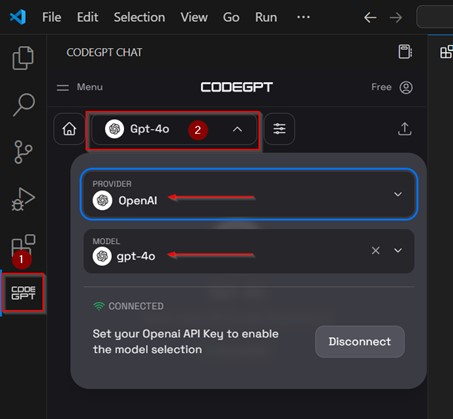
Once you have it, just select the provider as shown below and paste the API key created earlier.
Configure CodeGPT to work with the API key
Warning: before implementing any of the following steps make sure to save a backup of your Power BI report in case of accidental corruption of the metadata
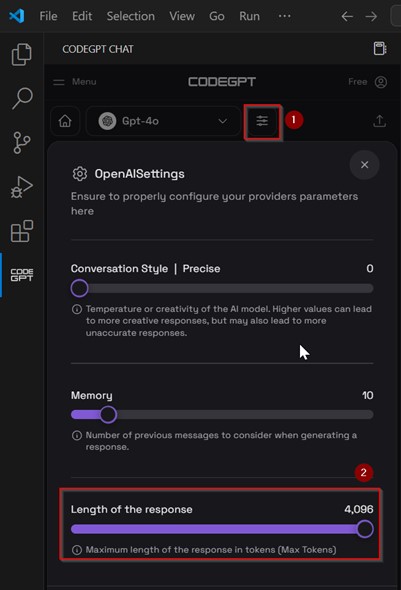
Warning: To avoid responses being truncated, make
sure to allow for the maximum number of tokens. This controls the potential
maximum cost of a query but using the Gpt-4o model, in the worst case scenario,
this would still only be $0.02 USD, as per pricing.
Configure options to avoid responses being cut-off
Organising the data model
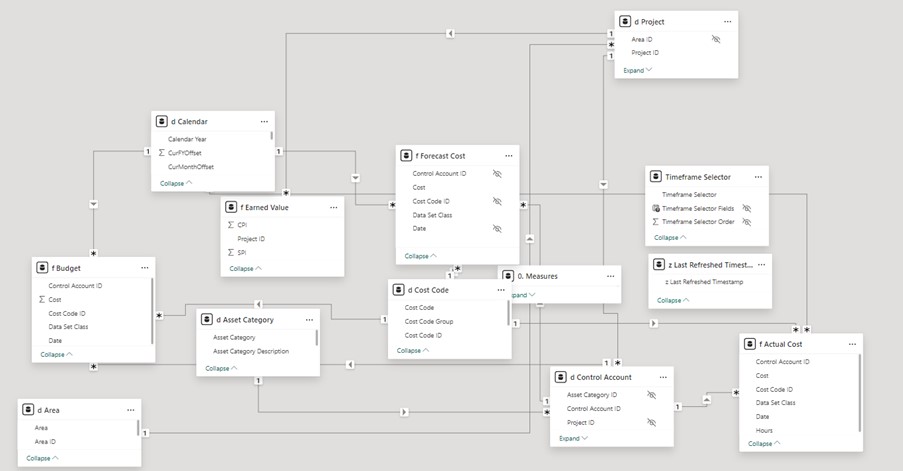
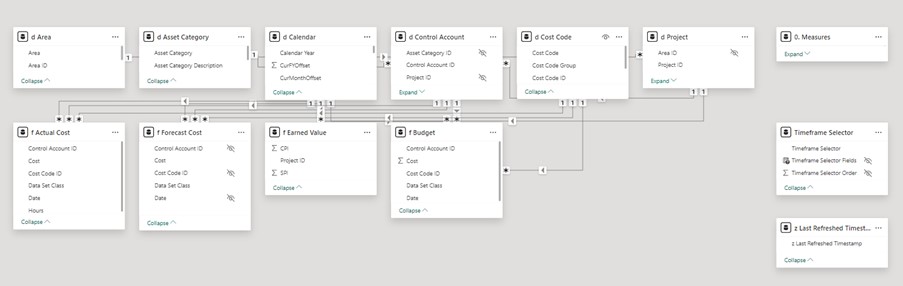
Say you have a data model that has grown with little organisation; it becomes hard to distinguish Dimension tables from Fact tables and how the relationships are set up.
A messy data model!
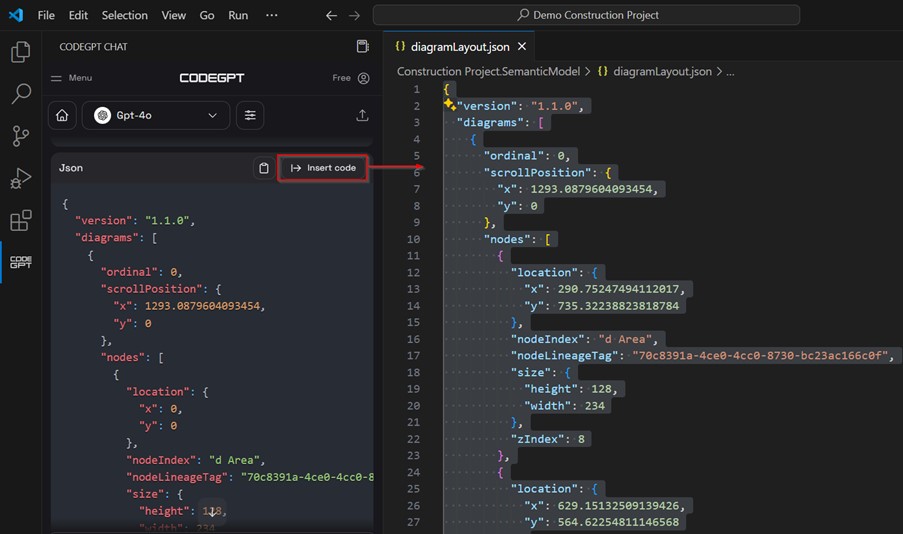
Using AI, it’s very easy to organise it all in one go! You can do this by locating the diagramLayout.json file in the Semantic Model folder. Then, simply use the prompt below followed by the json code in the diagramLayout.json
This code shows all tables on my Power BI data model and their X and Y coordinates. Revise the code to show all Dimension tables (starting with 'd') top aligned, spaced 30px horizontally, and all Fact tables (starting with 'f') 100px below them, also top aligned and spaced 30px. All other tables (not Dimensions or Facts) should be shown separately to the far right.
[Your json code here]
AI will then re-write your code, which you can replace in the json file just by clicking “Insert code”.
Inserting new code into the diagramLayout.json file. This controls how the data model is displayed in the model view
If you now save the json file and restart Power BI Desktop, you should see that the messy data model has been neatly organised as instructed!
A much better organised data model!
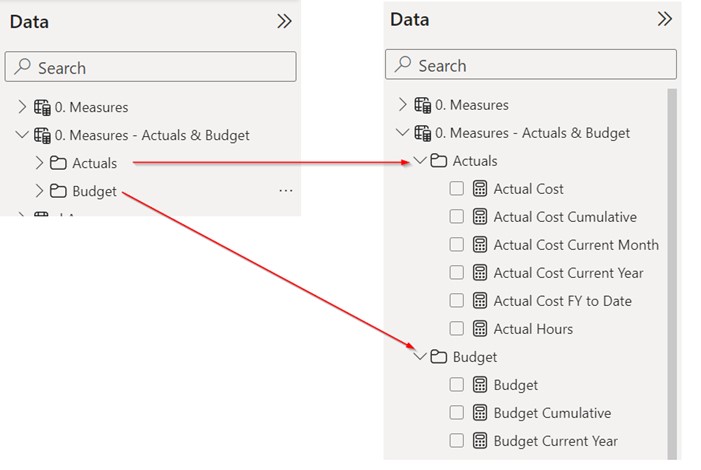
Assigning measures to folders
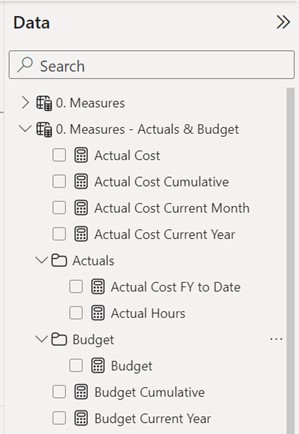
Now, let’s imagine you have many measures and they haven’t been consistently organised in folders. This can quickly become a problem as you try to find existing measures or figure out where they come from. Organising measures inside logical folders makes your life, as well as your co-workers’ lives, a lot easier.
Disorganised measures
To assign all measures to a folder, locate the table that contains the measures, inside the SemanticModel -> definition -> tables folder.
Then type the following prompt on CodeGPT:
Revise this TMDL code to assign any measures not inside a display folder to one that already exists. You have to determine which folder to assign the measure to based on what the measure is:

[Your code here]
You’ll then need to insert the revised code as shown below and save the file.
Insert revised code
If you restart Power BI, you should see that all the measures have been organised!
Measures have been organised correctly
Format Measures
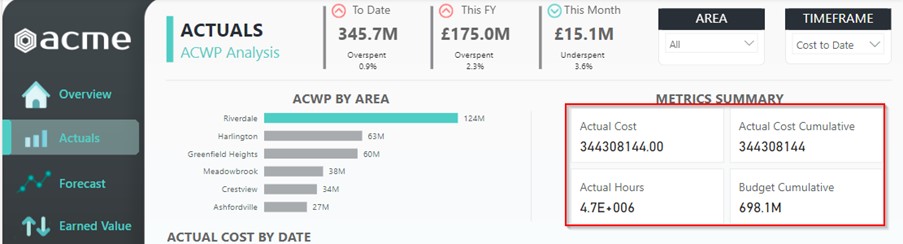
Another common occurrence with measures is that, as time goes by, formats tend to not be applied consistently. You often end up with different decimal places, currencies not formatted properly, thousands separators missing, etc, which is compounded when there’s multiple developers working on the same project.
You can see an example of this in the image below, where costs and hours have inconsistent formats.
Inconsistent formats
You can always go to the “Model view” in Power BI Desktop and select multiple measures that can be formatted in one go, but if you have different criteria for different measures you’ll have to keep repeating this.
Instead, let’s again locate the table that contains the measures we want to format in the SemanticModel -> definition -> tables folder and type the following prompt in CodeGPT:
Revise the TMDL code below to format all measures as follows:
– actual cost as pound sterling, 0 decimal places;
– hours as numbers with 1 decimal place and thousand separator;
– budget as pound sterling, 1 decimal place.
[Your code here]
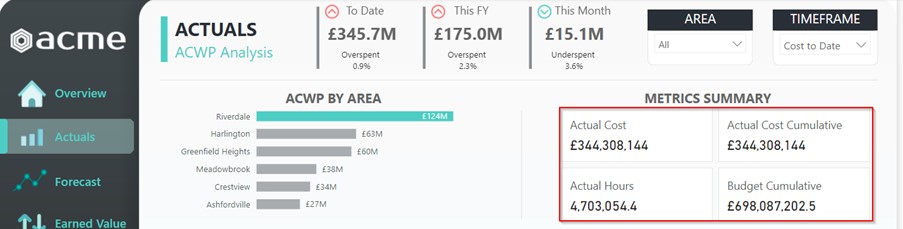
After replacing the code and re-opening Power BI, this is the result:
Formatted measures
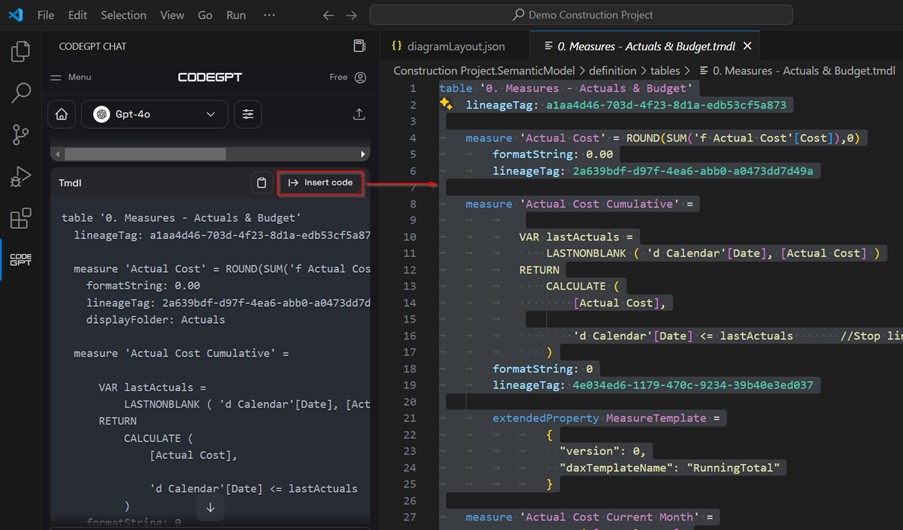
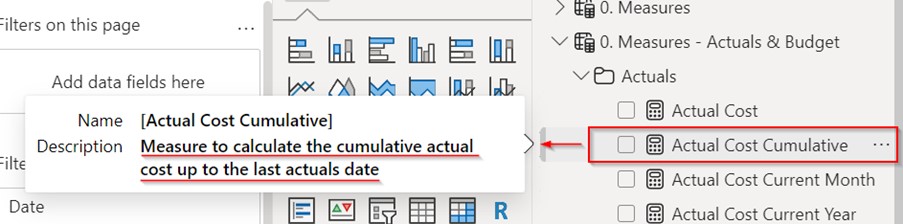
Documenting measures
One of the features of Copilot for Power BI is commenting measures and describing what they do, which can be very useful as documentation. However, the demos show that we have to do this individually for every measure, which can be time consuming.
Following the same method as before, we can type the following prompt on CodeGPT:
Revise this TMDL code to add a comment to each measure explaining what it does. In TMLD, a comment is added in the row preceding the 'measure' keyword and starts with '///'
[Your code here]
This is the result:
Commented measures
Changing visual elements
The final case study can be quite powerful if you’re using SVG for your icons and other visual elements. When possible, this is always a good idea, as SVGs scale without losing quality and are more easily customisable than image files like .png or .jpeg.
Let’s suppose you have an SVG icon as shown in the image below. One approach to make this customisable is building up the SVG as a DAX measure and passing a dynamic colour variable to adjust the hue – I’ve done this technique before, as shown here.
Can AI change the shape and colour of the icon?
However, a problem with this is that the report can get quite slow if you have many of these dynamic elements on the page. Instead, we can locate the SVG file on the Report -> StaticResources -> RegisteredResources folder and type the following command:
The SVG code below shows a house and is used as the image on a button. Change the code to add a window to the house, above the door, and change the hue to red:

[Your code here]
And the result is quite impressive! It not only was able to change the colours on the SVG as it was able to recognised what the shape was and added to it!
Yes it can!
However, a problem with this is that the report can get quite slow if you have many of these dynamic elements on the page. Instead, we can locate the SVG file on the Report -> StaticResources -> RegisteredResources folder and type the following command:
The SVG code below shows a house and is used as the image on a button. Change the code to add a window to the house, above the door, and change the hue to red:
[Your code here]
And the result is quite impressive! It not only was able to change the colours on the SVG as it was able to recognised what the shape was and added to it!
Limitations
Even though these are interesting capabilities, we should bear in mind a few limitations:
We’re still copy/pasting the code into the prompt (which we’d have to do using the ChatGPT approach anyway); I’ve found that you could simply refer to the previous code in your next prompt but that got me somewhat inaccurate results. Let’s not forget that TMDL requires proper indentation to work, and any deviation could corrupt the Power BI project;
We still have to closed and re-open the Power BI file to see the results, which might not be practical in some cases with large reports;
For the time being, it’s not yet feasible to manipulate visual elements such as charts or filters. That’s because all these elements live in the Report.json file which is a massive file and not practical to pass as a prompt. I understand there’s some development happening behind the scenes and my hope is that soon this file will be broken down into individual TMDL files, which will be much easier to handle.